
BY: ZACHARY HASS AND THOMAS NIELSEN, PURDUE UNIVERSITY
As many advances as we have made with statistical analysis…and the more effort is placed in trying to deduce talent…every once in a while there’s just this blaring exception. And I wonder now if people are sort of predisposed to just respond to any situation where the overall institution seem to have been wrong, because that just happened so rarely in every aspect of life now
… a part of us is sort of sad that everything about our life now can basically be told before it happens. Every time we see this situation like (Jeremy) Lin, where it makes no sense whatsoever and everyone was wrong it makes people happy.
— Chuck Klosterman on the public’s infatuation with Jeremy Lin’s success 1
As the eyes of sports fans turn to the parquets, anxiously anticipating the eventual outcomes of this year’s tournament, we decided to turn our attention to last year’s biggest upsets for guidance.
By utilizing a 1-16 seeding format, giving lower seeds frequent opportunities to knock out the higher seeds, the NCAA tournament seems inherently structured to appeal to our innate desire for a break in the seemingly predictable. As Klosterman theorizes, we may be seeking out situations that “make no sense” to balance our otherwise statistically calculable lives; and if he’s correct, few events can satisfy that desire quite like a 2 over 15 first round upset.
But how big are these upsets really? Or better still, are they even upsets at all? Are we truly watching “shocking” triumphs, or is the tournament’s structure producing an illusion? Games are played only once, but can be simulated many more times than that. By tabulating how often each team wins, a probability of victory can be assigned to each team.
We built a model to run simulations and observe outcomes. 2 The model used in the simulation estimates the strength of each team based on the regular season outcomes adjusted for home field advantage and strength of schedule. No conference tournament results were used in the model, since the object of the modeling exercise is to identify the strength of the team outside of the tournament-type atmosphere.
Although momentum, order of opponents, and a host of other factors certainly play a hand in who actually wins, the goal of the simulations is to fix a probability of victory between two opponents on a neutral court. Namely, if two teams meet a hundred times, how often would you expect each to win? This gives a more informative measure of how big an upset truly is, as opposed to simply looking at seed number.
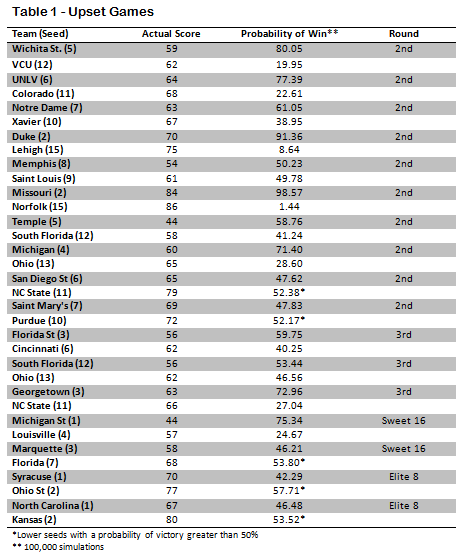
There were 62 games in the 2012 tournament that had the potential for a lower seed to beat a higher seed. The four games of the first round are essentially the same seed as their opponent, and both Ohio State and Kansas, who played each other in the Final Four, were two seeds. A little over one-fourth (17) of these games resulted in the lower seed emerging victorious.
Of these 17 upsets (see Table 1), almost a third (5) were expected by the model. In the second round, NC State over San Diego State, and Purdue over St. Mary’s occurred in over 50% of simulations. Likewise, Florida over Marquette in the Sweet 16, Ohio State over Syracuse, and Kansas over North Carolina in the Elite 8 would not be considered upsets by the model. In all five cases the odds are not far off from 50-50.
Of those that the model agrees are upsets, the 2/15 seed matchups immediately draw interest. According to the simulation, Lehigh had a 8.64% chance of defeating Duke, which means you could expect close to 1 win in every 11 tries. In contrast, Norfolk State had about a 1.44% chance of taking down Missouri, or about 1 win in 70 tries, which is pretty close to the odds for both of the other 15 seeds.
This means that the Lehigh upset was 6 times more likely than the Norfolk State upset, even though in both cases it was a 15 seed over a 2 seed. Additional big upsets include VCU over Wichita State (1 in 5), Colorado over UNLV (1 in 4.4), Louisville over Michigan State ( 1 in 4), NC State over Georgetown (1 in 3.7), and Ohio over Michigan (1 in 3.5).
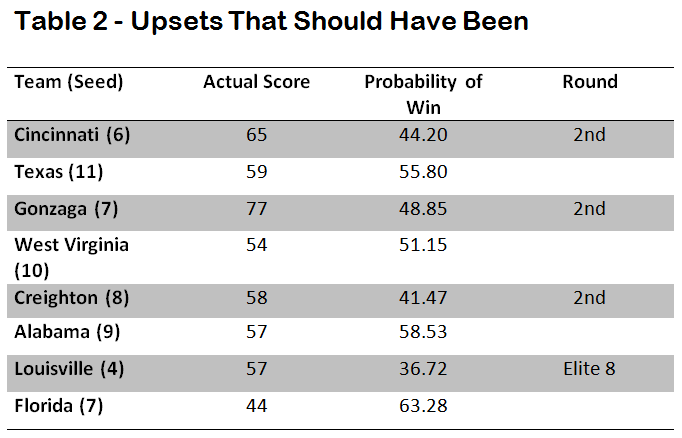
There were four games in the tournament that the model predicted should have been upsets, where the lower seed had a higher probability of victory than the higher seed, but did not win the game (see Table 2). The most surprising upset to fail to occur was Florida losing to Louisville in the Elite 8. According to the model, Florida should be expected to win 2 out of every 3 games.
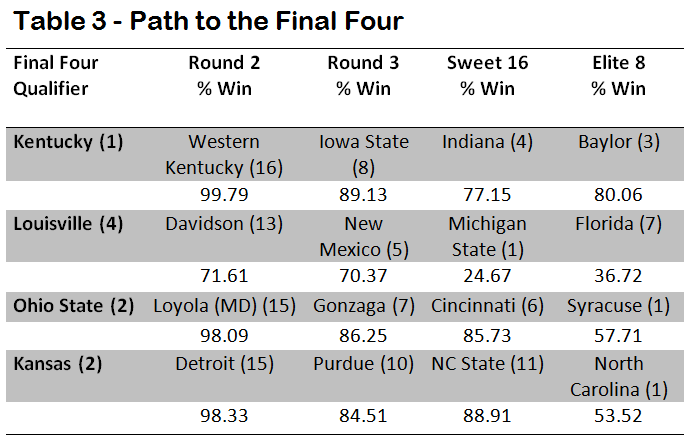
Who had the easiest path to the Final Four and who bucked the odds to make it there? Not all tournament runs are equal and the odds of making it to the end tend to favor higher seeds, yet it is uncommon to find all four final teams to be one seeds. Table 3 contains each of the Final Four qualifiers, their matchups from Round 2 to the Elite 8 and their probability of victory for each game. Kentucky was the most likely to make it to the Final Four, as the Wildcats had a 77% chance of victory or better in each of its games, which is fitting for the overall number one seed.
Louisville’s run was the most impressive, as the simulation had the Cardinals as the underdog in both their Sweet 16 and Elite 8 matchups. This also seems reasonable, as Coach Pitino’s team had the lowest seed of the four finalists.
When comparing seeding to the model-simulation outcomes, it is difficult to find much fault with the selection committee. Of the 62 matchups, only 9 times did the lower-seeded teams have a higher probability of victory, according to the model, than their higher-seeded opponents. Additionally there were only 17 upsets out of 62 chances (27%), which support the idea that the seeds are well chosen for such a competitive field of teams.
It is the prospect of the improbable that makes the tournament so exciting, and the simulation serves to quantify how improbable those events really are. Perhaps Klosterman is right to opine a present of predictability, but a calculated understanding of probability takes nothing away from the joy of the upset—the games, and their single outcome, make people happy.
Zachary Hass is a graduate of Case Western Reserve University where he played safety for the football team and holds a degree in Statistics and Economics. Currently he is working on a MS of Applied Statistics at Purdue University.
Thomas Nielsen is a graduate of Purdue University where he received a Bachelor’s Degree in Mathematical Statistics and a Master’s Degree in Applied Statistics. He currently works for an analytics company near Chicago.
References:
- While actionability is a key focus for data driven analysis that adds value for leaders, what’s not knowable from data can actually be more interesting – the surprises in life, not being able to peek inside the family gift closet – than what is or we think should be knowable, a point that was discussed by Bill Simmons and Chuck Klosterman on a February 17, 2012 podcast regarding Linsanity: http://espn.go.com/espnradio/play?id=7586974 ↩
- An offensive and defensive parameter was estimated based on all regular season game results using 5 data elements (Team, Points Scored, Opponent, Points Allowed, Home/Away/Neutral). 100,000 simulations were run for each matchup that actually occurred in the tournament. ↩