
By: Daniel C. Clay and Aniseh S. Bro
Key Insights
- Winning in NCAA Men’s Basketball is strongly influenced by a team’s success or failure in its previous game.
- A team that loses its previous game by a relatively small margin is more likely than average to win its next game; this “vengeful loser” effect is even stronger for the team that loses by a wide margin in its previous game.
- The opposite outcome is observed among teams with a previous win, especially a big win, bearing out the fears of the “over-confident winner.”
- Contributing to the higher winning percentage among teams that lost their previous games are nearly all performance variables, including: shooting percentages, rebounding, assists, and steals.
- Overall team performance, reflected in offensive and defensive efficiency ratings (points per possession), shows significant improvement, particularly in the wake of a “blow out” loss; there is a parallel decline after a previous win.
Many players, coaches, and fans will talk about the dangers of playing the “vengeful loser,” especially one that just suffered a big or embarrassing loss. There is also the danger of the “overconfident winner,” the cocky swagger they believe teams will adopt following a blow-out win. On the other hand are those who see a big win as a motivational positive, a characteristic of teams that are “on a roll” or gaining momentum; they contend that past success begets future success.
To test these opposing positions we draw upon a data base of 5,048 NCAA Division I Men’s Basketball game pairs collected over three seasons: 2001-2002, 2010-2011, and 2011-2012, and for all of the 111 teams in nine of the major college basketball conferences in the U.S.: Atlantic Coast (ACC), Atlantic 10, Big 12, Big East, Big 10, Conference USA, Mountain West, Pac 12, and Southeastern (SEC). We focus exclusively on data from the conference regular season. 1
Comparison of Winning Percentages by Previous Game Results 2
Our analysis starts by examining the question of whether previous game outcomes increase or decrease motivation to win their subsequent games—in other words does a previous win tend to lead to a subsequent win (positive momentum) or to a loss (overconfidence). Table 1 reports the results of a one-way analysis of variance (ANOVA) comparing the mean winning percentages for teams in the four previous game results categories. We find that teams that lose the previous game are significantly more likely to win the subsequent matchup, particularly when the previous loss is by 10 or more points (winning 53.9% of their games).
Similarly, the reverse effect is borne out by a like margin, with those having “won big” in the previous game coming up short in the subsequent game (winning only 44.6% of games). Comparing these means side by side, a team coming off a major loss is 22.6% more likely to win its next game than is the team coming off a wide-margin win. From Figure 1 it can be seen that the relationship is fairly linear, though presumably there would be a leveling off at each tail if extended out to point differentials even greater than 10. In other words, a 30-point loss may not provide much more motivation to win the next game than does a 20-point loss.
It is important to note that the means presented in Table 1 reflect the average proportional success rates that teams achieve after wins and losses. And because only regular season conference games are included in the study population, we know that the number of home games is essentially equal to the number of away games and that the timing of home and away games as well as the strength of opposing teams played are randomly distributed across the three seasons. Thus both home court advantage and strength of team, by far the two most important determinants in basketball game outcomes, are randomized out by design.
Table 1. Impact of Previous Game Results on Game Winning Percentages and Performance (ANOVA)
Previous Game Results
| Game Results | Lost by 10+ pts |
Lost by 1-9 pts |
Won by 1-9 pts |
Won by 10+ pts |
Total | F | Sig. | R |
| Mean Winning % | 53.9 | 52.2 | 48.1 | 44.6 | 44.8 | 5.013 | 0.00** | -0.11** |
Performance Variables
| Mean Field Goal % | 44.4 | 43.6 | 43.3 | 43.5 | 43.7 | 3.529 | 0.01* | -0.08** |
| Mean Free Throw % | 70.3 | 69.2 | 69.4 | 68.9 | 69.4 | 1.612 | 0.19 | -0.05 |
| Mean Total Rebounds | 31.3 | 31.4 | 31.4 | 31.2 | 31.3 | 0.265 | 0.85 | -0.01 |
| Mean Assists | 13.5 | 13.4 | 13.3 | 13.1 | 13.3 | 0.881 | 0.45 | -0.05 |
| Mean Steals | 6.5 | 6.4 | 6.4 | 6.2 | 6.4 | 1.087 | 0.35 | -0.04 |
| Mean Blocks | 3.6 | 3.6 | 3.6 | 3.6 | 3.6 | 0.248 | 0.86 | -0.01 |
| Mean Turnovers | 13.0 | 13.1 | 12.9 | 12.9 | 13.0 | 0.215 | 0.89 | -0.02 |
| Mean Personal Fouls | 18.3 | 18.1 | 18.1 | 18.2 | 18.2 | 0.535 | 0.66 | -0.02 |
| Mean Off. Rating | 104.4 | 102.2 | 101.9 | 102.1 | 102.6 | 3.854 | 0.00* | -0.07* |
| Mean Def. Rating | 102.3 | 102.5 | 102.2 | 104.5 | 102.9 | 4.083 | 0.00** | 0.07* |
| (N) | (294) | (303) | (301) | (291) | (1189) | (1189) |
** Significant at the 0.01 level (2-tailed).
* Significant at the 0.05 level (2-tailed).
On-court Performance Variables by Previous Game Results
Knowing that game outcomes are influenced by previous results is an important first step. The second question addressed in this analysis goes further; it asks whether there are particular channels through which the observed motivational differences play out. That is, are there particular on-the-court performance differences that stand out as the more proximate determinants of subsequent game success or failure?
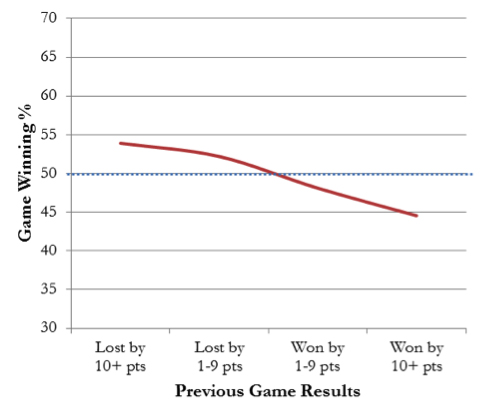
Figure 1. Mean winning Percentage by Previous Game Results
Only mean field goal percentage is significantly affected by previous game results from the group of eight standard player performance variables, where a previous loss is associated with a higher shooting percentage in the subsequent game.
But a closer look at the results in Table 1 tells a more complete story. After field goal percentage, the remaining seven player performance variables all show a slight, though not statistically significant, improvement after a previous loss. This association can be observed both in the comparison of means and the correlation coefficients (R) reported.
We conclude from the low yet highly consistent pattern of correlations that the motivational effects of a previous loss are channeled through the full array of on-court player performance variables, not through just one or two.
This conclusion is reinforced by the Table 1 ANOVA results for mean offensive and defensive efficiency ratings. Both of these variables are composite indicators comprised of several of the performance variables as noted above, and they constitute an effective overall gauge of quality of play at the team-level.
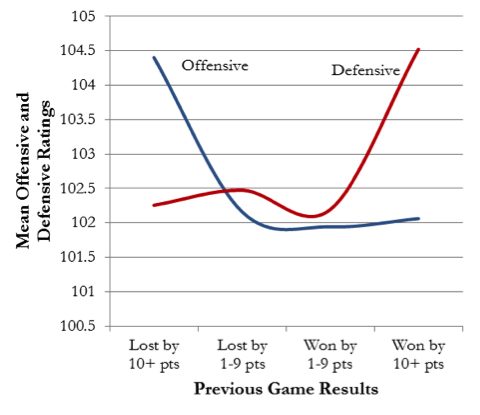
Figure 2. Mean Offensive and Defensive Ratings by Previous Game Results
As visually demonstrated in Figure 2, and consistent with the pattern of findings across the player level performance variables, offensive efficiency ratings are highest after a big loss, dropping to a steady lower level for all other previous game outcomes.
Defensive efficiency shows a near mirror image pattern in which the rating is especially poor (high scores by the opponent) after a blow-out win, then improving (declining) for all other outcomes.
Thus, we conclude that individually no performance variable stands out as a unique channel through which greater motivation from a previous loss or overconfidence from a previous win is expressed. Rather, these influences seem to affect in subtle ways virtually all aspects of performance on the court and, in turn, final game outcomes.
Conclusions:
Motivational factors are known to be among the leading determinants of game outcomes. Our analysis reveals that how teams fare in their previous game is one of those factors. We find that a previous loss tends to motivate a team to win its subsequent game, and that a previous win will increase the likelihood of a loss in the next game.
We also conclude that the motivational impact of a previous game is played out not through just one or two dimensions of on-court performance, but almost imperceptibly through all aspects of the game, such as shooting percentages, assists, rebounds and overall offensive and defensive efficiency ratings. While some observers speak of “momentum,” suggesting that teams get “on a roll” and build confidence with successive wins, our analysis shows compelling evidence to the contrary—a win more often than not results in a subsequent loss.
Perhaps these findings should come as no great surprise; they are consistent with other basketball analytics that have concluded, for example, that being behind by a small margin at halftime more often results in winning than in losing in the NBA. Similarly, we know that in the first round of the NCAA Men’s Basketball Tournament the 9th seed upsets the higher 8th seed over 53% of the time. The motivational forces mustered from a loss or a deficit or simply the perception of being the underdog are strong enough to influence how well teams play and, in turn, their final outcomes.
We give special thanks to Daniel C. Clay and Aniseh S. Bro for their contribution to this article.
 Daniel Clay – Dan is a professor in the Department of Community Sustainability at Michigan State University. He is accomplished in the analysis of large-scale data sets in socioeconomic research. He leads an interdisciplinary team in sports analytics focused on coach-controlled, ecological, and on-court determinants of success in men’s college basketball.
 Aniseh Bro – Aniseh is a statistician and PhD candidate in the Department of Community Sustainability at Michigan State University. She serves as a research assistant on projects in sports analytics and international development at MSU.
References:
- By targeting intra-conference games we avoid the biases and distortions typically observed during the non-conference season (November-December) where teams can be egregiously mismatched and invariably favor the major conference schools with home court/region advantage. Post-season games in March-April are likewise excluded from this analysis because the single-elimination structure of all of the conference tournaments and the NCAA Tournament means that only the winners advance to the next round, making these game-pairs (defined as a previous and subsequent game) unsuitable for the purpose of studying previous game effects. Other games dropped from the analysis are those very rare cases where the previous game for one of the teams was played more than one week earlier. With such a large gap between game pairs it is reasoned that the motivational effects of the previous game will have significantly waned. ↩
- A special challenge for the present analysis is to account for relative team strength and other potential factors that may bias or condition how previous game results affect winning percentages. Strong teams win more games than weaker teams and have higher winning percentages, regardless of whether they win or lose their previous games. Consequently, teams that win their previous games tend to win their subsequent games simply because they are better teams. To eliminate this team strength effect, we aggregate data in such a way as to compare each team’s performance only to its own, proportionally across four categories of previous game results:
1 2 3 4 Major Loss Minor Loss Minor Win Major Win (10+ points) (1-9 points) (1-9 points) (10+ points) A hypothetical example here may be instructive. Hoops University played 17 regular conference games; 16 of them, all but the first, followed a previous regular conference game. Of these 16 game pairs, there were 4 in each of the 4 categories, (Loss 10+, Loss 1-9, Win 1-9, Win 10+). Hoops U won 100% of those in the first category, 75% in the second category, 50% in the third, and 25% in the fourth. We observe that, on average, Hoops U is more likely to win after a previous loss, especially after a big loss, than after a previous win.
In computing these four winning percentages for all 111 teams, for each of the three study years, we generate an aggregated data set containing 1,189 cases at the “year-team-previous result” level. In addition to winning percentages for each of the four previous results categories, a set of 10 on-the-court performance variables is created for the same four categories. These variables constitute the eight principal performance variables recorded by the NCAA: field goal percentage, free throw percentage, total rebounds, assists, steals, blocks, turnovers and personal fouls, plus two computed variables, offensive and defensive efficiency ratings, i.e., points per possession (PPP) and opponent’s PPP. Possessions are computed as: FGA – OREB + TOV + (0.4*FTA)3 ↩