
No “northern” school—defined as north of 38 degrees N latitude—has claimed the College World Series title since Wichita State accomplished the feat in 1989. The Big Ten as a whole hasn’t visited Omaha since 1984, and you’d have to go all the way back to 1966 to locate the conference’s last national championship. In a previous study, we found that for baseball recruiting, average temperature and number of recruits are positively correlated: On average, the number of recruits increases by 1.93 for each increase in degree Fahrenheit. Nearly 85% of the variance in number of recruits can be attributed to changes in temperature.
What role does location play in on-field success for northerly baseball programs and – perhaps more importantly – what innovations are the most forward-thinking programs implementing to level the playing field?
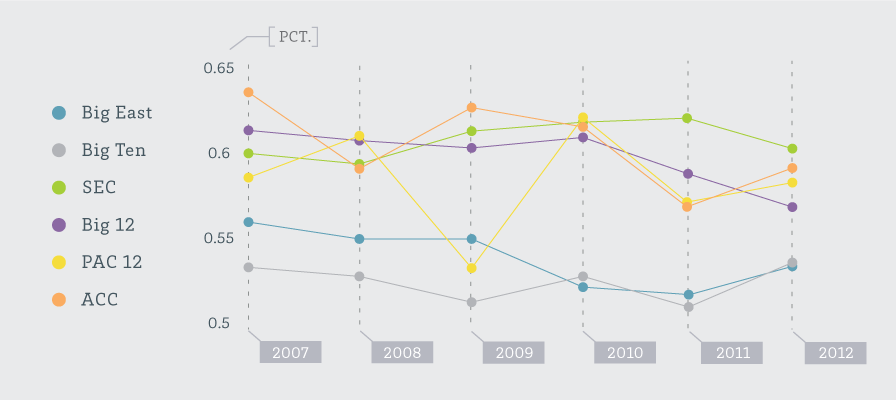
It’s important first to determine the extent of the gulf between warm-weather and cold-weather schools continues to be, even among the major conferences, who generally occupy the same tier in other popular sports conference averages for a number of metrics. We found that with the exception of a down 2009 in the Pac-10, programs in the Big Ten and Big East have consistently notched anywhere from 4-10 fewer wins than, and finished 50-100 RPI places, behind the other four power conferences over the last six seasons.
Of course, the obvious culprit behind stunted program development in the North is seasonal climate. With baseball’s opening day increasingly intruded upon by the groundhog’s glimpse of its own shadow, it’s no wonder teams in higher, wintery latitudes are hard-pressed to escape meteorological realities, i.e. eclipsed in performance by schools in temperate zones conducive for early-season home games.
Consider that Florida State fit in 15 games at their Dick Howser Stadium before Indiana ever took the field for its first of just 19 home games at Bart Kaufman Field. In a sport where the home team triumphs about 60% of the time, according to NCAA figures, a prolonged road trip or home stand can make a significant impact.
Ironically, when those two teams met in the Tallahassee Super Regional last weekend, it was the vagrant Hoosiers who emerged victorious, in a clean sweep over the home team Seminoles. And fascinatingly, Indiana in large part owes its success to the home it hardly ever calls a home. With the sport indefinitely opposed to proposals advocating for a later start date or brief fall campaign, Indiana—among a number of other northern programs—resolved to take matters into its own hands in order to remedy its inherent disadvantage.
Bart Kaufman Stadium offers a unique solution to Indiana’s cold-weather woes, cutting out the literal dirty work needed to maintain a field exposed to harsh winters. Its entire surface is turf—including the pitcher’s mound—which makes it the first of its kind in D-I baseball. Even more than other predominantly turf fields—such as those recently constructed at Virginia Tech, Louisville, and Ohio State or recently approved for construction at Michigan—Bart Kaufman’s ingenious environment allows for quicker draining and snow removal.
The result is that these squads can now get more preseason use out of their home diamonds. And what’s more, the other universities making use of advances in playing surfaces—Indiana, Louisville, and Virginia Tech—reaped postseason use out of their fields, too, as all three were selected to host regionals this past May.
Virginia Tech also recently added a new indoor hitting facility within the past few years (for the 2010 season). In addition to batting cages, the structure’s turf carpeting offers comparable conditions to their newly renovated home field, as well as instructional video labs, in which players can receive immediate feedback on their form and technique. Kent State, fresh off a Cinderella run to Omaha in 2012, unveiled similar plans for its own indoor hitting facilities just last month.
And Kent State isn’t the only recent CWS underdog to commit a significant facilities investment soon after defying the tournament’s South and West norm. Two years removed from its storybook, program-saving party crash at the 2011 College World Series, the Cal Golden Bears waged a serious homefield makeover this season to help keep the baseball team solvent.
By installing lighting structures at Evans Field, Cal could play its first televised night games in 2013. Along with a new video screen for advertisements, Cal was able to significantly expand exposure for a program that was supposed to disappear after 2011.
For schools in the North, the overall numbers from the last few seasons suggest nothing of the gap narrowing. But the seeds have been planted. The 2013 season marks the first year that the RPI weighs road wins more heavily than home wins, and by extension, home losses more heavily than road losses, too. Expect that to aid the standing of the nomadic North, but so too will the models presented by northerners ahead of the curve.
After Kent State and Stony Brook revealed last year that, in fact—victory is possible for those in northerly latitudes—Indiana comes to Omaha having already ended one historic conference drought, and with its sights set on toppling another. For these programs, a nasty weather forecast wasn’t going to stop the precipitating winds of change.
Yearly Conference Averages
Big East
| Big East | Wins | Losses | Pct. | RPI | Revenue |
| 2007 | 32.08 | 25.50 | .557 | 113.83 | $534,888.25 |
| 2008 | 30.75 | 25.17 | .550 | 123.67 | $589,991.92 |
| 2009 | 30.25 | 24.75 | .550 | 119.83 | $684,481.67 |
| 2010 | 29.82 | 27.36 | .521 | 121.73 | $632,559.67 |
| 2011 | 29.08 | 27.17 | .517 | 128.92 | $675,244.67 |
| 2012 | 30.58 | 27.00 | .531 | 124.83 | # N/A |
Big Ten
| Big Ten | Wins | Losses | Pct. | RPI | Revenue |
| 2007 | 29.80 | 26.60 | .53 | 117.70 | $303,658.00 |
| 2008 | 28.40 | 27.70 | .51 | 141.70 | $366,927.20 |
| 2009 | 28.10 | 26.30 | .52 | 132.60 | $410,242.00 |
| 2010 | 29.20 | 26.10 | .53 | 119.60 | $412,364.10 |
| 2011 | 27.30 | 26.40 | .51 | 145.40 | $498,059.20 |
| 2012 | 30.09 | 26.45 | .53 | 114.18 | # N/A |
ACC
| ACC | Wins | Losses | Pct. | RPI | Revenue |
| 2007 | 37.25 | 21.83 | .63 | 37.17 | $742,294.00 |
| 2008 | 35.67 | 24.50 | .593 | 51.75 | $745,174.83 |
| 2009 | 38.17 | 23.42 | .62 | 42.75 | $920,191.50 |
| 2010 | 35.75 | 23.08 | .608 | 38.83 | $1,052,800.83 |
| 2011 | 34.83 | 26.33 | .569 | 50.17 | $1,133,943.67 |
| 2012 | 35.75 | 23.75 | .601 | 37.17 | # N/A |
SEC
| SEC | Wins | Losses | Pct. | RPI | Revenue |
| 2007 | 36.00 | 23.75 | .603 | 37.92 | $1,156,307.83 |
| 2008 | 36.58 | 25.00 | .594 | 45.67 | $1,648,066.67 |
| 2009 | 37.08 | 23.92 | .608 | 30.67 | $2,008,739.83 |
| 2010 | 37.92 | 23.92 | .613 | 31.67 | $1,823,334.92 |
| 2011 | 37.75 | 23.75 | .614 | 35.67 | $2,228,098.50 |
| 2012 | 37.75 | 24.58 | .606 | 39.25 | # N/A |
Big 12
| Big 12 | Wins | Losses | Pct. | RPI | Revenue |
| 2007 | 36.90 | 23.40 | .612 | 41.90 | $1,235,781.00 |
| 2008 | 36.10 | 23.40 | .607 | 42.70 | $1,213,245.80 |
| 2009 | 36.10 | 23.90 | .602 | 39.40 | $1,368,582.70 |
| 2010 | 36.00 | 23.30 | .607 | 47.10 | $1,419,147.30 |
| 2011 | 35.50 | 25.00 | .587 | 47.80 | $1,858,799.70 |
| 2012 | 34.33 | 25.11 | .578 | 70.11 | # N/A |
Pac 12
| Pac 12 | Wins | Losses | Pct. | RPI | Revenue |
| 2007 | 34.89 | 23.78 | .595 | 48.44 | $755,985.33 |
| 2008 | 35.22 | 22.67 | .608 | 38.67 | $635,849.44 |
| 2009 | 29.80 | 26.60 | .528 | 86.80 | $817,131.10 |
| 2010 | 36.20 | 23.10 | .610 | 32.10 | $975,823.30 |
| 2011 | 33.20 | 24.90 | .571 | 51.10 | $1,161,500.60 |
| 2012 | 34.82 | 23.82 | .594 | 50.09 | # N/A |
Overall Graph View: