

Cited in: ![]()
The 2013 NCAA Men’s Basketball Final Four is set, and there have been numerous announcements recently regarding conference changes. Now is a good time to explore how much money is going to be distributed and to whom.
The money for payments comes from a fund the NCAA maintains for basketball that compensates conferences for achievement in the tournament. Units last for six years and conferences are compensated depending on the number of units amassed in the six tournaments previous. Unit values are derived from the total NCAA Men’s Basketball tournament purse, which is a product of annual NCAA total revenues, less expenses and distributions.
The NCAA revenue for a year—(expenses amount to roughly 40% retained by the NCAA to put on championships, pay employees, offer services and programs, etc.)—results in ~60% distributed to schools, with men’s basketball units representing ~35% of that distribution (other distributions go to Student-Athlete Opportunity, Special Assistance, Sports Sponsorship, Grants-in-Aid, and Academic Enhancement programs). Money typically flows through conferences and once distributed to a specific school, the money is fungible and can be used by the institution to cover any costs they choose. 1
Let’s examine just how much each team could possibly earn from this year’s games. The exact value of units depends on the payout increases in the coming years. After a steady increase of 8% from 2003 to 2011, which saw the per unit pay get up to $239,670, the increases have slowed the last two years. A 1% increase in 2012 took the payout to $242,204 per unit, and another 1.4% increase this year brought the payout to $245,514.
If we use a conservative estimate of 1% per year, and an aggressive estimate of 8% per year, we end up with the following ranges:
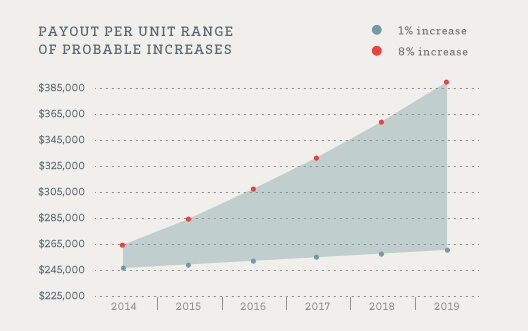
That means that a win in the tournament over the past few weeks could be worth as little as $1.525 million or possibly as much as $1.945 million to a school.
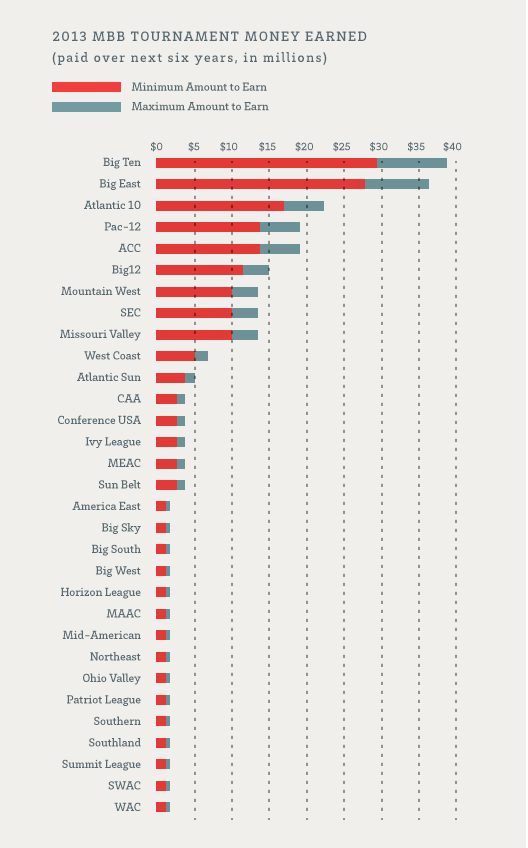
So, based on how many games each conference appeared in, here are the amounts they could earn.
And here are the teams that are currently worth the most:
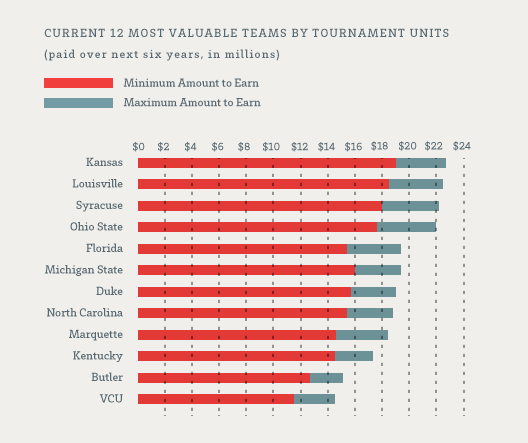
Four of those big-earning teams are in transition, switching conferences either this year or next. So let’s examine the biggest conferences, those that will need to assess how conference realignment affects distribution and adjust.
The biggest story in conference realignment, in regard to men’s basketball, is the impending split of the Big East. The New Big East (the Catholic 7 from the Old Big East, along with Butler, Creighton, and Xavier) will be a combination of teams that have earned 35 at-large bids in the last ten seasons, and will undoubtedly be earning a high number of bids each year in the future.
Those schools will likely need to continue their success, since, as of March 31, 2013, they’re not slated to have any past units carry forward next year (though this may not be set in stone). 2 The units of the three teams joining the conference will stay with the conferences they’re representing now (the Atlantic 10 and Missouri Valley), while the units of the New Big East teams, as well as the units of the four Old Big East teams moving to the ACC (Notre Dame, Syracuse; Pittsburgh in 2013, and Louisville in 2014), will stay with the Renamed Big East conference teams. (Whether or not the Old Big East teams—UConn, South Florida, and Cincinnati—will keep the funds for themselves, or share them with the seven teams that will be joining to form the Renamed Big East, has yet to be determined.)
In terms of sheer money, that means that the New Big East will miss between $29.7-$35.8 million if they are not able to keep their units, as well as a portion of the $50.7-$61.5 million from the four teams that are moving to the ACC.
The Renamed Big East, however, will also likely miss out on revenue from units, as the teams they have joining them have not historically been as strong as the Catholic 7 when it comes to earning tournament units. Memphis and Temple’s 31 and 32 units will be going to Conference USA and the Atlantic 10 conferences, respectively, but of the other five teams joining the Renamed Big East (UCF, East Carolina, Houston, SMU, and Tulane) only Houston is due any units (3) for 2014-19.
The ACC is in a good position going forward, as they’ll start earning units based on the play of Notre Dame, Syracuse, Pittsburgh, and Louisville in the upcoming years. They would have benefitted more significantly had Maryland, a historically solid team, not had a few down years. The ACC is only due 10 units (anywhere from 2.5-$2.8) from Maryland before the Terrapins move to the Big Ten later this year.
The Atlantic 10, Missouri Valley, and Conference USA may not fair quite so well. Despite the fact that they will keep the unit revenue from the strong teams departing their conference, the teams that they’re losing are likely to have a high potential for future earnings, however, the conferences are not currently replacing those departures with comparably strong-earning teams.
Minimum Number of Units Earned by School
|
Old Conf. |
School |
New Conf. |
2014 |
2015* |
2016* |
2017* |
2018* |
2019* |
2014-19 |
|
ACC |
Duke |
ACC |
18 |
16 |
13 |
8 |
5 |
4 |
64 |
|
ACC |
North Carolina |
ACC |
20 |
15 |
10 |
10 |
6 |
2 |
63 |
|
ACC |
Florida State |
ACC |
7 |
7 |
6 |
5 |
2 |
0 |
27 |
|
ACC |
NC State |
ACC |
4 |
4 |
4 |
4 |
4 |
1 |
21 |
|
ACC |
Miami (FL) |
ACC |
5 |
3 |
3 |
3 |
3 |
3 |
20 |
|
ACC |
Clemson |
ACC |
5 |
4 |
3 |
2 |
0 |
0 |
14 |
|
ACC |
Maryland |
Big Ten |
4 |
4 |
2 |
0 |
0 |
0 |
10 |
|
ACC |
Wake Forest |
ACC |
3 |
3 |
2 |
0 |
0 |
0 |
8 |
|
ACC |
Georgia Tech |
ACC |
2 |
2 |
2 |
0 |
0 |
0 |
6 |
|
ACC |
Virginia |
ACC |
1 |
1 |
1 |
1 |
1 |
0 |
5 |
|
ACC |
Boston College |
ACC |
1 |
1 |
0 |
0 |
0 |
0 |
2 |
|
ACC |
Virginia Tech |
ACC |
0 |
0 |
0 |
0 |
0 |
0 |
0 |
|
Old Big East |
Notre Dame |
ACC |
7 |
5 |
5 |
4 |
2 |
1 |
24 |
|
Old Big East |
Pittsburgh |
ACC |
11 |
9 |
5 |
3 |
1 |
1 |
30 |
|
Old Big East |
Syracuse |
ACC |
17 |
17 |
14 |
11 |
9 |
5 |
73 |
|
Old Big East |
Louisville |
ACC |
20 |
16 |
12 |
11 |
10 |
5 |
74 |
|
Atlantic 10 |
Butler |
New Big East |
15 |
13 |
12 |
7 |
2 |
2 |
51 |
|
Atlantic 10 |
Xavier |
New Big East |
14 |
10 |
7 |
4 |
3 |
0 |
38 |
|
Missouri Valley |
Creighton |
New Big East |
4 |
4 |
4 |
4 |
4 |
2 |
22 |
|
Old Big East |
Marquette |
New Big East |
15 |
13 |
11 |
10 |
7 |
4 |
60 |
|
Old Big East |
Villanova |
New Big East |
12 |
9 |
4 |
2 |
1 |
1 |
29 |
|
Old Big East |
Georgetown |
New Big East |
7 |
5 |
5 |
4 |
3 |
1 |
25 |
|
Old Big East |
St. John’s |
New Big East |
1 |
1 |
1 |
1 |
0 |
0 |
4 |
|
Old Big East |
DePaul |
New Big East |
0 |
0 |
0 |
0 |
0 |
0 |
0 |
|
Old Big East |
Providence |
New Big East |
0 |
0 |
0 |
0 |
0 |
0 |
0 |
|
Old Big East |
Seton Hall |
New Big East |
0 |
0 |
0 |
0 |
0 |
0 |
0 |
|
Old Big East |
Connecticut |
Renamed Big East |
12 |
11 |
6 |
6 |
1 |
0 |
36 |
|
Old Big East |
Cincinnati |
Renamed Big East |
6 |
6 |
6 |
6 |
4 |
1 |
29 |
|
Old Big East |
South Florida |
Renamed Big East |
3 |
3 |
3 |
3 |
3 |
0 |
15 |
|
Conference USA |
Central Florida |
Renamed Big East |
0 |
0 |
0 |
0 |
0 |
0 |
0 |
|
Conference USA |
East Carolina |
Renamed Big East |
0 |
0 |
0 |
0 |
0 |
0 |
0 |
|
Conference USA |
Houston |
Renamed Big East |
1 |
1 |
1 |
0 |
0 |
0 |
3 |
|
Conference USA |
Memphis |
Renamed Big East |
12 |
7 |
4 |
4 |
3 |
2 |
32 |
|
Conference USA |
SMU |
Renamed Big East |
0 |
0 |
0 |
0 |
0 |
0 |
0 |
|
Atlantic 10 |
Temple |
Renamed Big East |
8 |
7 |
6 |
5 |
3 |
2 |
31 |
|
Conference USA |
Tulane |
Renamed Big East |
0 |
0 |
0 |
0 |
0 |
0 |
0 |
| *2015-19 data will include unknown future units earned in 2014-18. | |||||||||
References:
- For more on units see:
http://www.forbes.com/sites/chrissmith/2013/03/21/a-single-ncaa-tournament-victory-is-worth-1-5-million/ ↩
- Via Andy Katz on ESPN’s Big East Blog:
http://espn.go.com/blog/bigeast/post/_/id/40663/big-questions-on-exits-from-big-east ↩