
Part Three of a four-part, fiscal efficiencies series:
- (Part One: Football Expenditures)
- (Part Two: Basketball Expenditures)
- (Part Four: Revenue, Expenditure, and ROI)
When considering third-party review and media reporting about athletic budgets, especially the amount of institutional funds earmarked to support athletics versus educational programs, more precise metrics may help athletic directors to inform productive dialogue with various constituencies and optimize resource allocation planning. Given that athletic departments are often viewed as a microcosm of the university structure (in which university-wide, zero sum based budgeting is common) and given that athletic budgets do not traditionally disaggregate the portion of costs associated with direct student-athlete expenditures, it would seem prudent to use metrics that we consider total spending for both entities rather than where university-level expenses are restricted to education-related and athletics are total athletic expenditures. Therefore, in this study, we used data from Division I athletic programs and institutional expenditure data from the same source as the Knight Commission’s report and then we drilled down further:
1. We matched expenditure level at the school level in order to provide a more accurate view for comparing academic and athletic expenditures. 1
2. We adjusted for inflation, using the Higher Education Price Index to provide more accurate estimates of increases.
3. We used two metrics for institutional level expenditures—Education and Related (E&R) 2 and Education and General (E&G). E&R expenditures look only at expenditures directly related to the educational enterprise of the educational process, while E&G uses all general and education-related expenditures. However, the E&G might be a more accurate measure to compare academic and athletic expenditures.
Using this approach for the data, we found: While athletic budgets appear to rise at a slightly faster rate despite decreasing academic appropriations, the difference in the growth rate [table 1] is not nearly as large as media and watchdog organizations proclaim. In fact, athletic budgets within the FBS appear to have a more consistent growth with its academic counterparts, based on the average yearly growth of both academic-related budgets and the total athletic operating expenditures [table 2].
Table 2 shows a five-year trend looking at the average school-level ratio of athletic to both E&R and E&G expenditures for FBS conferences. Over the past three years (2007-2009) the gap between athletic and academic expenditures of both metrics is decelerating. 3
Table 1 — Average Yearly Growth of Athletic and Academic Expenditures, 2005-2009 (Adjusting for Inflation)

Education and General Definition: Total education and general expenditures includes all core operating expenditures, including sponsored research, but excluding auxiliary enterprises. Includes the sum of expenditures on instruction, research, public service, academic support, student services, institutional support, operations and maintenance, and scholarships and fellowships.
Education and Related Definition: Total spending on direct educational costs. Education and related expenses includes spending on instruction, student services, and the education share of spending on central academic and administrative support, and operations and maintenance. The sum of education and related expenses, research and related expenses, public service and related expenses, and scholarships and fellowships totals to education and general expenses.
Data Sources: Athletic expenditures at the school level were provided by Win AD. Institutional expenditures on students were provided by NCES Integrated Postsecondary Education Data System (IPEDS); Office of Postsecondary Education Equity in Athletics database.
Table 2 — Direct Comparison of FBS Conferences’ Academic and Athletics Spending by Fiscal Year, 2005-2009 (Adjusted for Inflation)

Often times automatic-qualifying conferences are cited as a cause for the raising averages in athletic expenditures. Table 3 provides a conference-level comparison on 2009 academic and athletic expenditures. Results show that the severity of the difference is directly related to the metrics of comparison. Using the E&R metric, the athletic expenditures per athlete are as much as 9.6 times that of E&R expenditures per student. However, using the E&G metric, the athletic expenditures for athletics are only as much as 4.7 times that of the E&G expenditures per student.
Table 3 — Direct Comparison of Academic and Athletics Spending by Division I Subdivision and FBS Conference on a Per Capita Basis, 2009

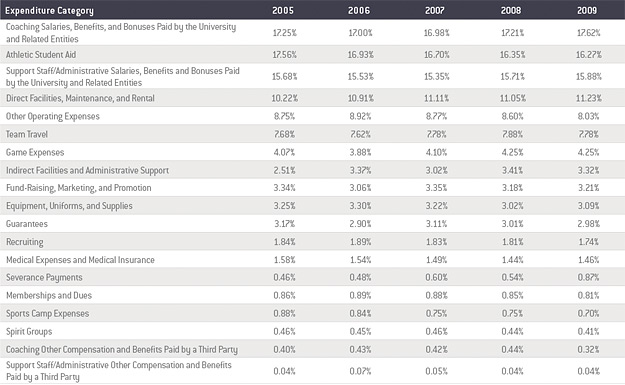
Conversations regarding athletic budgets sometimes stop at the macro-level. However, understanding the trends within athletic budgets provides further insight into internal and external forces impacting rising expenditures. Table 4 provides a detailed five-year trend on the percent of budget allocated to each expenditure categories. Evident in the table, salaries of the coaches and staff—along with athletic aid—represents almost 50% of 2009 athletic budgets. This is particularly interesting given that coaching and staff salaries are influenced by market forces, and athletic student aid is a product of NCAA scholarship requirements and tuition prices set outside of the athletic department. In particular with athletic aid and non-salary benefits, athletic departments have little opportunity to constrain any increases due to external mandates and forces.
Table 4 — Distribution of Athletic Expense Categories of FBS Conferences’ Athletic Budgets by Fiscal Year, 2005-2009
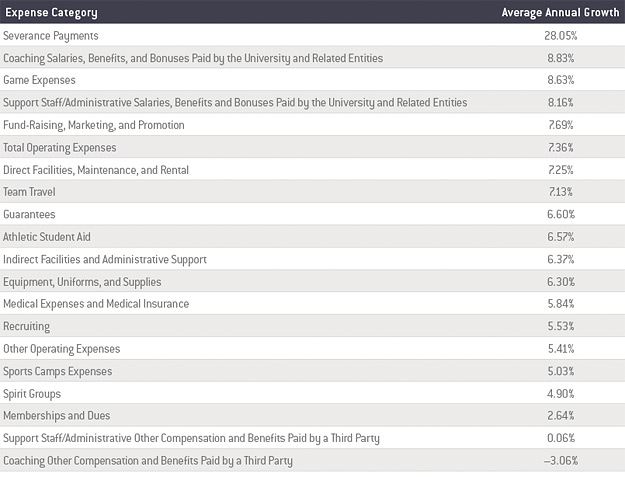
Along with understanding distribution patterns, shifts in expenditures provide additional insight into the how athletic departments are operating. Table 5 provides information on the average annual growth of each expenditure category for FBS conference athletic departments. While there appears to be a general consistent growth around 7% of all categories, severance payments have seen a significant increase in the past five years. Additionally, there appears to be decreasing supporting for coach and athletic personnel from third parties. In combination with Table 4, the move away from third-party compensation could lead to potentially large future expenses for athletic departments. The advent of substantially larger severance payments may also place short-term constraints on the financial efficiency of athletic departments.
In conclusion, cogent analysis of complex issues requires context—that’s core to Win AD. This article suggests more complete data provide more accurate perspectives. While the data do not refute the claims that athletic expenditures are rising at a faster rate than academic expenditures, this article puts the data in a more helpful framework and articulates how the use of various measures of academic expenditures can illuminate the conversation.
Table 5 — Average Annual Growth of Athletic Expense Categories of FBS Conferences’ Athletic Budgets, 2005-2009
Key Insights
An increase in severance payments and a decrease in third-party financial support both offer significant fiscal challenges for athletic directors. Severance payouts have increased significantly in the past five years and potentially place short-term financial constraints on athletic departments, while there is a trend toward less support for coaches and other athletic personnel from third parties.
References:
- Prior studies have used median values (e.g., Knight Commission) as the mechanism for comparison and do not look at the direct school-level ratio of academic to athletic expenditures. ↩
- The recent Knight Commission report uses the E&R metric for its comparison. ↩
- Both metrics provide a substantially smaller ratio than the one provided within the Knight Commission’s report of 6.8. This is due to the use of direct school level comparison rather than median values. ↩
About the Author