
Key Takeaways
- The biggest difference between FBS, FCS, and non-Football Athletic Student Aid distribution is in the number of student athletes receiving aid.
- Over three years, the number of athletes receiving aid stayed very stable.
- Schools raising Tuition, Fees, and other Aid-covered expenses are highest at FBS institutions – nearly $1,000 per year – while FCS and non-Football institutions averaged an increase of about $750, and $350 per year, respectively.
Using data from the Win AD system, 1 we examined over 200 institutions over three recent seasons (2009-10, 2010-11, and 2011-12), totaling 628 institutional seasons, to see how much the average school spends on Athletic Student Aid each year. Here’s what we found:
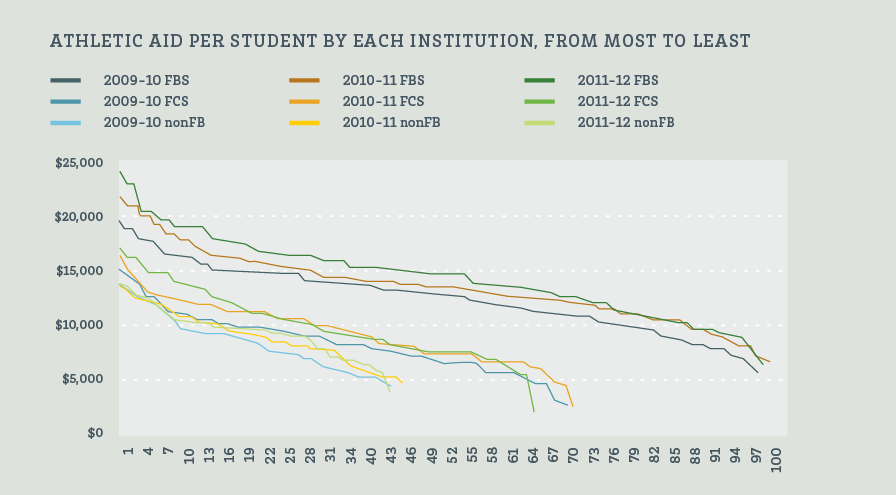
In the three types of institutions we studied (FBS, FCS, and non-Football), the biggest difference was in the number of student athletes receiving aid. FBS institutions usually provided for 488 student athletes, FCS institutions usually provided for 357 student athletes, and non-Football institutions usually provided for 275 student athletes. The average aid per athlete was a bit higher at the FBS level, averaging $13,309 over the three seasons studied, but it was similar at FCS ($9,150) and non-Football institutions ($8,756). Because the number of athletes stayed very stable over those three years though, we can see just how much schools were raising Tuition, Fees, and other Aid-covered expenses.
Average Aid per Athlete
| FBS | FCS | non-Football | All | |
| 2009-10 | $12,495 | $8,429 | $8,426 | $10,335 |
| 2010-11 | $13,209 | $9,178 | $8,705 | $10,964 |
| 2011-12 | $14,215 | $9,897 | $9,138 | $11,827 |
| All | $13,309 | $9,150 | $8,756 | $11,036 |
The increases were highest at FBS institutions, nearly $1,000 per year, while FCS and non-Football institutions averaged an increase of about $750, and $350 per year, respectively.
How much are those averages being skewed by teams that give extraordinarily high or extraordinarily low amounts of aid? Probably not by much in any division. Even though there’s a wide gap between the highest and lowest amounts of student aid per athlete in each division the standard deviation between the highs and lows is relatively stable.
FBS
| High | Low | |||
| 2009-10 | Michigan | $19,379 | $5,571 | LA-Lafayette |
| 2010-11 | Arizona | $21,477 | $6,460 | LA-Lafayette |
| 2011-12 | Tennessee | $23,729 | $6,223 | LA-Lafayette |
FCS
| High | Low | |||
| 2009-10 | Coastal Carolina | $15,158 | $2,634 | Prairie View A&M |
| 2010-11 | Rhode Island | $,16,080 | $2,446 | Western Carolina |
| 2011-12 | Rhode Island | $16,803 | $2,046 | Western Carolina |
non-Football
| High | Low | |||
| 2009-10 | Winthrop | $13,749 | $4,553 | Cal St-Northridge |
| 2010-11 | Winthrop | $13,363 | $4,511 | Umass, Lowell |
| 2011-12 | UNC Greensboro | $13,568 | $3,791 | Umass, Lowell |
Since tuition and fees vary by institution, it makes sense that some schools must spend more on athletic aid. The amount of aid is dependent on what each institution charges for tuition and fees, as well as how many of their student-athletes are from out-of-state, often resulting in a higher tuition and fees rate.
By division and year, here are the schools that have needed to spend the most, and the least, on student-athlete aid over the three years studied:
FBS
| High | Low | |||
| 2009-10 | Michigan | $19,379 | $5,571 | LA-Lafayette |
| Georgia Tech | $18,589 | $6,165 | LA-Monroe | |
| Tennessee | $18,572 | $6,864 | Oklahoma St | |
| Colorado | $18,023 | $7,176 | Texas State | |
| Oregon | $17,797 | $7,295 | South Alabama | |
| 2010-11 | Arizona | $21,477 | $6,460 | LA-Lafayette |
| Colorado | $20,892 | $6,784 | South Alabama | |
| Georgia Tech | $20,687 | $6,983 | Oklahoma St | |
| Oregon | $19,957 | $7,755 | LA-Monroe | |
| Michigan | $19,947 | $7,838 | Texas St | |
| 2011-12 | Tennessee | $23,729 | $6,223 | LA-Lafayette |
| Colorado | $22,609 | $7,290 | Oklahoma St | |
| Arizona | $22,608 | $7,766 | LA-Monroe | |
| Clemson | $20,123 | $8,530 | Troy | |
| Memphis | $20,068 | $8,709 | Minnesota |
FCS
| High | Low | |||
| 2009-10 | Coastal Carolina | $15,158 | $2,634 | Prairie View A&M |
| Rhode Island | $14,803 | $2,965 | Savannah St | |
| New Hampshire | $14,145 | $3,204 | Western Carolina | |
| Maine | $13,677 | $4,562 | South Dakota St | |
| South Carolina St | $12,712 | $4,614 | South Dakota | |
| 2010-11 | Rhode Island | $16,080 | $2,446 | Western Carolina |
| New Hampshire | $14,880 | $4,194 | South Dakota St | |
| Maine | $14,100 | $4,500 | Savannah St | |
| South Carolina St | $13,293 | $4,637 | McNeese St | |
| Coastal Carolina | $12,915 | $5,472 | South Dakota | |
| 2011-12 | Rhode Island | $16,803 | $2,046 | Western Carolina |
| New Hampshire | $15,977 | $5,275 | McNeese St | |
| South Carolina St | $15,884 | $5,440 | South Dakota St | |
| James Madison | $15,491 | $5,853 | Nicholls St | |
| North Carolina A&T St | $14,843 | $6,204 | Prairie View A&M |
non-Football
| High | Low | |||
| 2009-10 | Winthrop | $13,749 | $4,553 | Cal St-Northridge |
| MD-Eastern Shore | $12,906 | $4,772 | Utah Valley | |
| UIC | $12,637 | $5,173 | Cal St-Bakersfield | |
| MO-Kansas City | $12,308 | $5,208 | Cal St-Fullerton | |
| Chicago St | $12,255 | $5,288 | UNC Asheville | |
| 2010-11 | Winthrop | $13,363 | $4,511 | Umass, Lowell |
| MO-Kansas City | $12,952 | $4,969 | Cal St-Northridge | |
| VCU | $12,289 | $5,076 | Utah Valley | |
| New Jersey Tech | $12,173 | $5,118 | UNC Wilmington | |
| East Tennessee St | $12,053 | $5,164 | Cal St-Fullerton | |
| 2011-12 | Vermont | $13,568 | $3,791 | Umass, Lowell |
| UNC Greensboro | $13,427 | $5,508 | Cal St-Northridge | |
| Winthrop | $12,794 | $5,718 | Utah Valley | |
| MO-Kansas City | $12,528 | $6,127 | Cal St-Bakersfield | |
| VCU | $12,363 | $6,210 | Chicago St |
References:
- Financial athletic aid data for each school’s Tuition & Fees for the years in question from Win AD database (NCAA Financial Reports). The number of student athletes was calculated from the EADA (specifically “Unduplicated Count Men’s Participation” and “Unduplicated Count Women’s Participation” fields). ↩