
Winthrop Intelligence is making it easier to stay current on conference realignment. Our Conference Realignment Maps gives you an easy-to-digest view of moves in the ACC, AAC, Big 10, Big 12, PAC 12, and SEC since 2010, plus moves coming in 2014. See Average Total Revenue, Average Total Expense, and Total Football Expense at a glance, for a broad view of shifting conference landscapes.
These conference moves got us wondering how revenues compare with expenses at institutions in the AQ conferences over the last four years. 1 Let’s take a look conference by conference, using conference makeup in 2014 as our guideline:
| 2009 | 2010 | 2011 | 2012 | |
| ACC | $6,778,938 | $4,873,812 | $7,863,470 | $6,364,004 |
| Big 10 | $9,281,949 | $10,036,965 | $11,772,655 | $9,841,394 |
| Pac 12 | $2,847,941 | $1,980,224 | $1,017,996 | $3,478,825 |
| Big 12 | $11,812,817 | $15,872,949 | $13,978,240 | $12,511,200 |
| SEC | $15,498,862 | $22,051,804 | $21,167,705 | $18,110,669 |
| AAC | $-6,332,249 | $-4,886,095 | $-3,258,234 | $100,272 |
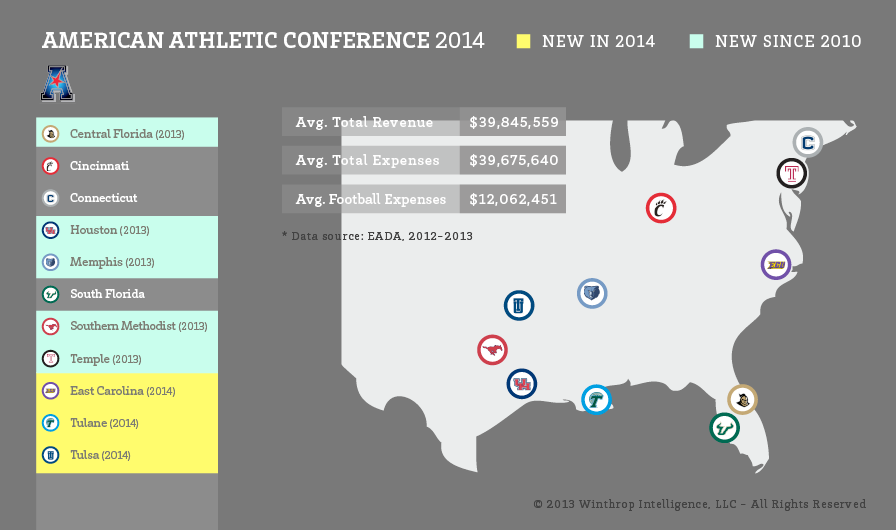
American Athletic Conference
*(schools not included: SMU, Temple, Tulane, Tulsa)
As a whole, the schools of the AAC have turned things around more than any other group of institutions. The average institution spent over $6M more than they received in 2009, but by 2012 that average had flipped to $100K in the black. All of the seven institutions studied had at least one season in the red, but three of the seven of them brought in more than they spent in 2012 (UFC, ECU, and Houston). Two others significantly reduced the amount they were in the red (Cincinnati by 82% and Connecticut by 98%), and one other (Memphis) moved into the black in 2011 after begin $12M and $14M in the red the previous two years. South Florida still spent nearly $1.8M more than they took in in 2012, but that was down from the $3.2M and $2.1 they overspent in 2009 and 2011.
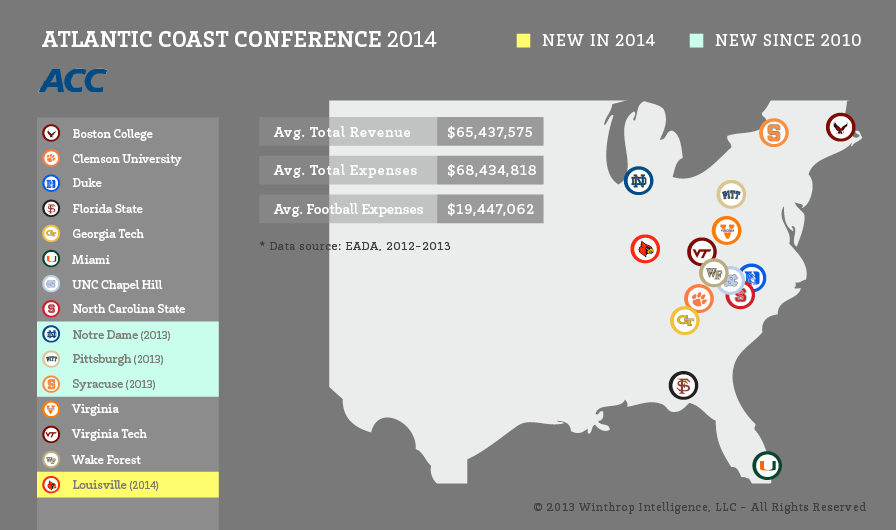
Atlantic Coast Conference
*(schools not included: Boston College, Duke, Miami (FL), Notre Dame, Pittsburgh, Syracuse, Wake Forest)
Most of the time, the public schools in the ACC are in the black – only three of the eight institutions studied ever finished a season in the red, and only one of the eight did it more than once (Virginia 2009-2011). The average amount those schools brought in each season was a solid $50M, with a high of $100M (Florida State in 2012) and a low of $30M (Virginia in 2011).
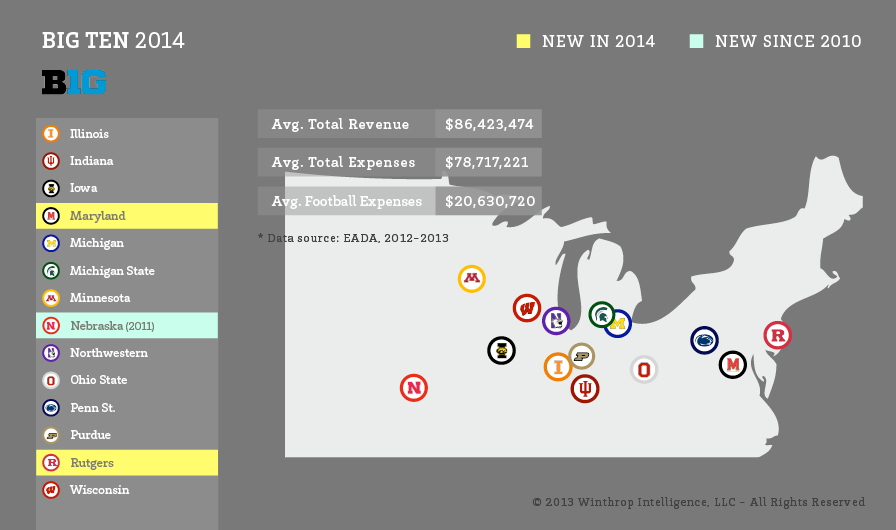
Big Ten Conference
*(schools not included: Northwestern, Penn State)
Like the ACC, most of the time the Big Ten schools are fiscally in the black: only two have finished a season in the red (Maryland while a member of the ACC from 2009-2011, and Purdue in 2012). The highest earners of the group have topped $100M three different times (Ohio State in 2011, Wisconsin in 2012, and Michigan in 2012 with a whopping $140M), and Big Ten institutions have been more than $10M in the black 56% of the time.
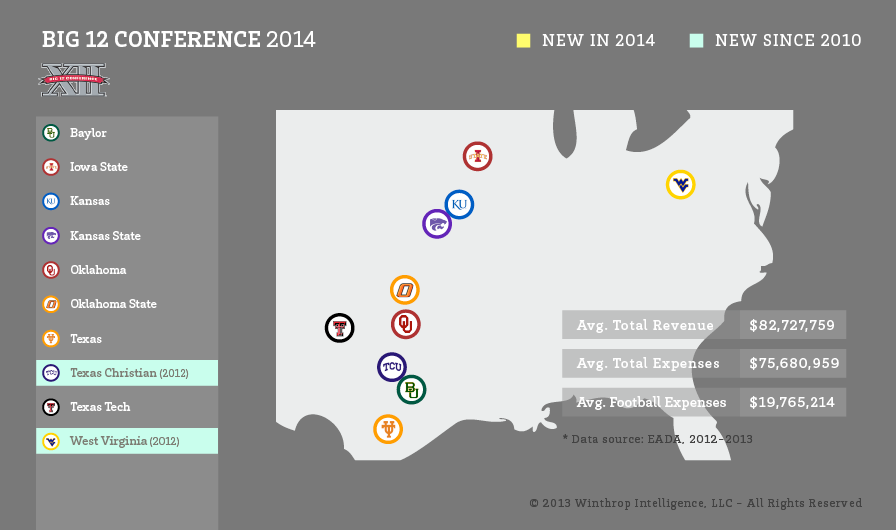
Big Twelve Conference
*(schools not included: Baylor, TCU)
The current Big Twelve lineup has averaged a profit of over $10M each of the last four seasons, but that is mainly due to the fortunes of Texas, Oklahoma, and Oklahoma State. Those three earned an average of $120M, $77M, and $47M, respectively, earning profits of $64M, $16M, and $17M. The other five institutions averaged a profit of just $2.2M, finishing in the red 35% of the time, including Kansas’ four straight seasons spending more than it has taken in.
Pac Twelve Conference
*(schools not included: USC, Stanford)
Aside from the newly-formed AAC, the Pac 12 spends less on athletics than any other conference: an average of $41M per year, with a high of $72M and a low of $22M. Overall their balance sheets are usually pretty close to zero, with institutions being within $5M of zero in the red or black 67% of the time. There’s a great deal of fluctuation within those balance sheets too: only one institution, Arizona State, has had their profit decrease in three straight years, and none had their profit increase in three straight years.

Southeastern Conference
*(schools not included: Vanderbilt)
It’s no surprise that the SEC brings in the most money and spends the most money. Four different institutions have topped the $100M revenue mark one time each, and two of those years those same schools topped the $100M expenditure mark. Only one institution has ever finished the year in the red: Missouri in 2012, their first year in the SEC, spent $16M more than they brought in. The average profit each year topped $19M, with a high of $58M (Texas A&M in 2012).

*2012 numbers were unavailable for the following schools, so projections were used based on previous years’ data: Memphis, Louisville, NC State, Oklahoma St, Texas, Auburn, and Tennessee.
Check out our conference realignment page.
References:
- Data from the Equity in Athletics Data Analysis from the Office of Post-Secondary Education. ↩