
In this study, we’ll examine trends in the schools transitioning from Division II to Division I. First, we’ll look at their athletic revenues and expenses within a five-year period (2007-2011), and compare those to the average and the 90th percentile of Division II sports. We’ll next explore the number of undergraduates, to see if there is a definite trend of larger colleges with larger athletic budgets making the jump.
In the five-year period leading up to 2011, we found six colleges that made the transition:
- Abilene Christian University
- Grand Canyon University
- University of the Incarnate Word
- University of Massachusetts-Lowell
- Northern Kentucky University
- University of Nebraska at Omaha
Out of these six schools, Abilene Christian and University of the Incarnate Word are adding football. And while the University of Nebraska at Omaha formerly fielded a football team as a Division II member, it cut its team to join the Summit League, which does not offer football (thus grouped with those “without football.”)
Our question was: Do these six teams out earn and outspend their counterparts?
The data is below:
Division-II – With Football – Expenses
| Category | Average | 90th Percentile | Abilene Christian | Incarnate Word | |
| 2007 2011 |
Undergrads: # of people |
4,092 3,852 |
8,387 7,676 |
3,996 3,540 |
2,872 4,096 |
| 2007 2011 Change |
Basketball: $ (in millions) |
.7 .82 .12 |
1.1 1.24 .14 |
.9 1.2 .3 |
.72 1.1 .38 |
| 2007 2011 Change |
Football: $ (in millions) |
.95 1.15 .2 |
1.45 1.66 .21 |
1.66 2.07 .41 |
0 1.96 1.96 |
| 2007 2011 Change |
Total Expenses: $ (in millions) |
4.2 5.09 .89 |
6.63 8.02 1.39 |
6.9 8.6 1.7 |
5.41 9.11 3.7 |
Division-II – With Football – Revenues
| Category | Average | 90th Percentile | Abilene Christian | Incarnate Word | |
| 2007 2011 Change Avg. Profit (2011) |
Basketball: $ (in millions) |
.67 .82 .15 0 |
1.09 1.21 .12 -.3 |
.84 1.21 .37 .01 |
.72 1.1 .38 0 |
| 2007 2011 Change Avg. Profit (2011) |
Football: $ (in millions) |
.92 1.17 .25 .02 |
1.45 1.69 .24 .03 |
1.63 2.07 .44 0 |
0 1.41 1.41 -.55 |
| 2007 2011 Change Avg. Profit (2011) |
Total Revenues: $ (in millions) |
4.28 5.19 .91 .1 |
6.79 8.1 1.31 .08 |
6.9 8.62 1.72 .02 |
5.5 9.2 3.7 .09 |
Division-II – Without Football – Expenses
| Category | Average | 90th Percentile | Grand Canyon | Northern Kentucky | Umass – Lowell | Nebraska Omaha* | |
| 2007 2011 |
Undergrads: # of people |
3,522 3,862 |
6,699 8,934 |
1,714 3,682 |
9,301 9,805 |
5,957 8,365 |
8,612 9,268 |
| 2007 2011 Change |
Basketball: $ (in millions) |
.63 .78 .15 |
1.07 1.27 .2 |
.542 1.9 1.36 |
1.16 1.9 .74 |
1.09 1.38 .29 |
.77 1.6 .83 |
| 2007 2011 Change |
Total Expenses: $ (in millions) |
3.0 3.93 .93 |
5.39 6.69 .93 |
3.82 9.89 6.07 |
4.45 9.12 4.67 |
6.16 7.43 1.27 |
9 10.39 1.39 |
Division-II – Without Football – Revenues
| Category | Average | 90th Percentile | Grand Canyon | Northern Kentucky | Umass – Lowell | Nebraska Omaha* | |
| 2007 2011 Change Avg. Profit (2011) |
Basketball: $ (in millions) |
.61 .79 .18 .01 |
1.1 1.28 .18 .01 |
.54 1.91 1.37 .01 |
1.16 2.01 .85 .11 |
1.17 1.38 .21 0 |
.77 1.68 .91 .08 |
| 2007 2011 Change Avg. Profit (2011) |
Total Revenues: $ (in millions) |
3.06 3.99 .93 .06 |
5.46 6.67 1.21 -.02 |
3.81 9.89 6.08 0 |
4.45 9.12 4.67 0 |
6.57 7.42 .85 -.01 |
9.03 10.39 1.36 0 |
*Note – Nebraska Omaha had football until it moved to Division-I
As indicated by the tables, all 6 schools are far above the average in Basketball, Football (for those that have football), and Total Expenditures, even above the 90th percentile in terms of spending and revenue. Nebraska Omaha spent about three times the average in 2007, and increased both revenue and expenditures in 2011. These results indicate expenditures as one of the main drivers for a team that can compete on the Division I level.
The second aspect of this study explores whether school size directly correlates with total expenses of a school. Are only the largest Division II schools moving up to Division I?
The data is below:
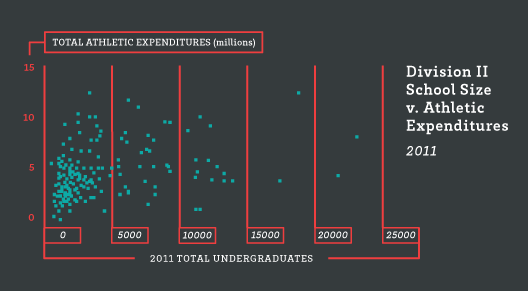
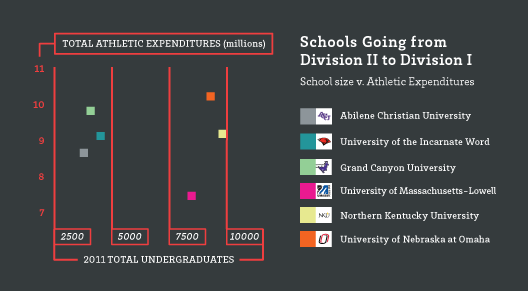
While the data tells us is that there is a correlation between school size and the amount that school spends on athletics, there are numerous smaller schools that have high athletic budgets. It seems a team like Nebraska at Omaha could move to Division I because of its high athletics budget, but Grand Canyon has almost an equally high budget with 5600 less students. The second graph reveals more of these insights.
While three of the teams have large student bodies and large expenditures (UMass-Lowell, Northern Kentucky, and University of Nebraska at Omaha), the other teams, including both of those with football, do not. So while this may represent a trend in Division II schools in general, it is far from the rule when transitioning to Division I.
No matter the size of the institution, the distinct pattern in teams moving from Division II to Division I is financial—Revenues and Expenses tend to be very significant. Spending in the top 10% of Division II schools is correlated for the 6 teams moving to Division I. If you can afford to make the move, however, the size of the institution seems not to be a significant indicator.