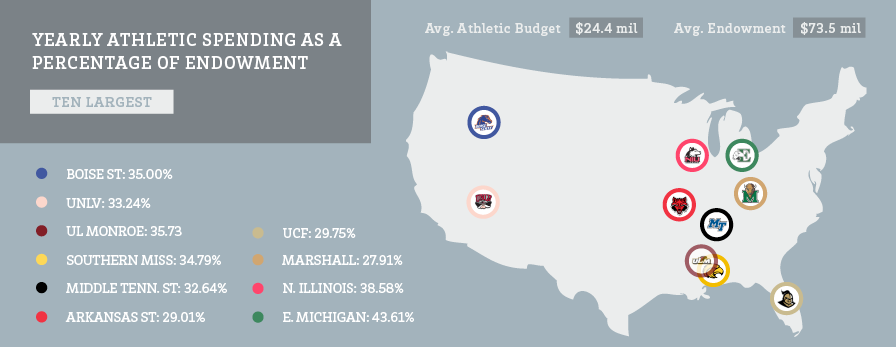
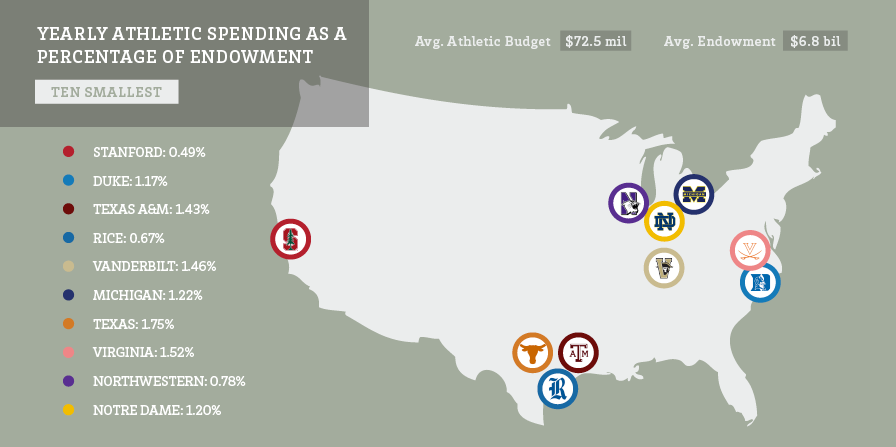
The relationship between a school’s overall endowment and the amount they spend on athletics each year is tangential at best, but we thought it might be an interesting exercise to compare the two. Below are charts depicting the top ten smallest and largest athletic spending as a percentage of endowment numbers across Division 1-A.
Overall, the median athletic budget in 2010 Division 1-A was a shade under $50 million, while the median endowment was $500 million. The median budget-to-endowment percentage was 9%.
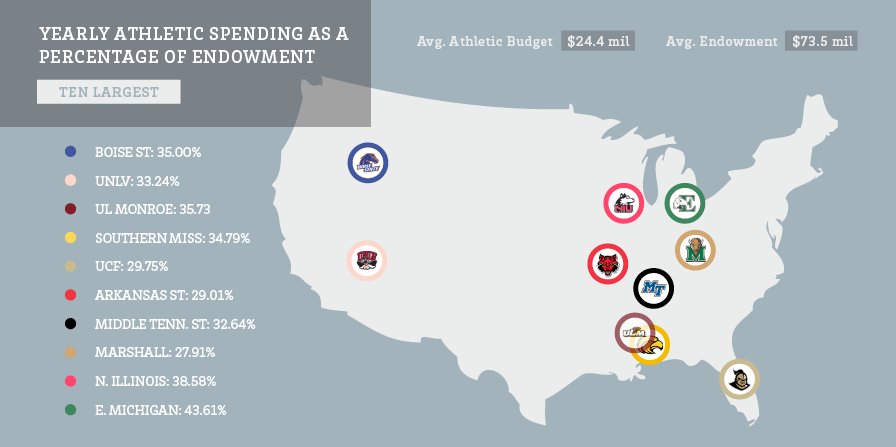
Looking at the differences between the top ten smallest and biggest percentages, it would seem that the schools in the smallest endowment chart are doing a fantastic job at not letting their budgets get out of control, and that the schools in the largest endowment chart could really be applying money better elsewhere. But looking closer, we can see that the schools with the biggest endowments spend nearly three times as much on their athletics each year than the schools with small endowments.
Add to that the fact that every single Division 1-A school was revenue neutral in 2010 (taking in as much money, if not more, than they spent), and the fact that over half of the schools (69 of 118) took in more money than they spent to the tune of an extra $385 million dollars combined, the evidence shows that as a whole athletic directors in Division 1-A are great stewards of their resources.