
There is an ongoing debate about whether athletic department revenues from student fees should be counted as a subsidy or generated revenues. 1 Will a change in accounting procedures effect the perception that the vast majority of athletic programs lose money? Using NCAA data, let’s take a look.
We examined the figures of 227 institutions from D-I through D-III—nearly 1,800 ‘institutional years’ of data (2005-2012 for each institution)—and found that when student fees were counted as a subsidy, schools’ revenues met or exceeded their yearly expenses 22% of the time.

Of the 22% of institutional years with an even or net-positive financial outcome, the majority (281 of 830, or 34.3%) were turned in by FBS programs. Only 114 of 978 (11.7%) turned in by non-FBS programs were even or net positive, which averages out to approximately one net positive year per non-FBS institution over the 8-years of data for the study.
Of the non-FBS group, three institutions broke even or earned money in every year we studied, and another 13 broke even or earned money in at least half of the 8 years. There were 96 institutions (of the 124) that lost money on athletics in every year studied.
In the FBS, 11 institutions broke even or earned money in every year studied, and another 29 broke even or earned money in at least 4 of the 8 years. Of the FBS institutions, 44 lost money on athletics in every year studied.
The chart below indicates that FBS programs tend to lose more on average than non-FBS:
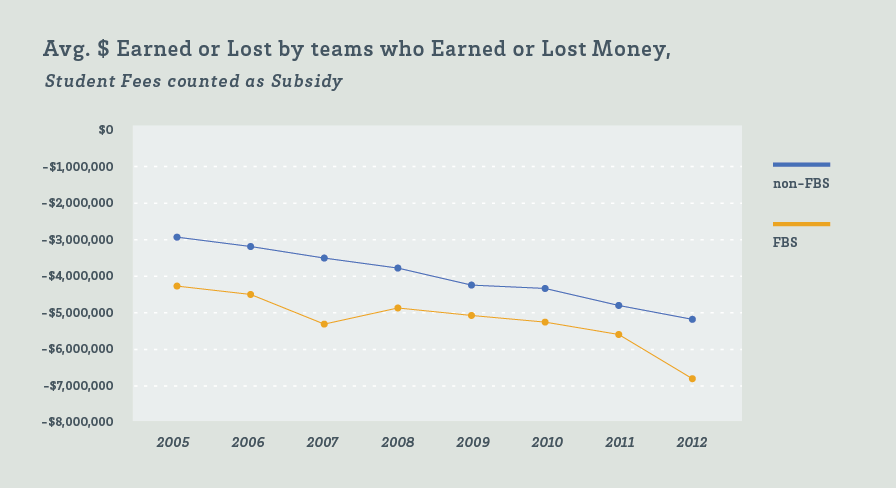
Those FBS programs also tend to earn more money. FBS schools with a net positive yearly financial outcome averaged earnings of $5.6 million, while the average amount earned by the non-FBS institutions was $636K.
Over the whole eight-year span, 40 institutions out of the 227 (17.6%) earned money or broke even. Of those 40, seven were non-FBS schools. This reveals that 117 (94.4%) of the non-FBS teams studied lost money over the last eight fiscal years. As a whole, NCAA institutions have earned just over $42 billion in the last eight years, and have spent nearly $47billion—a difference of -$4.69billion.
But how does this story change if we count student fees as revenue instead of a subsidy?
As it turns out, the story changes dramatically.
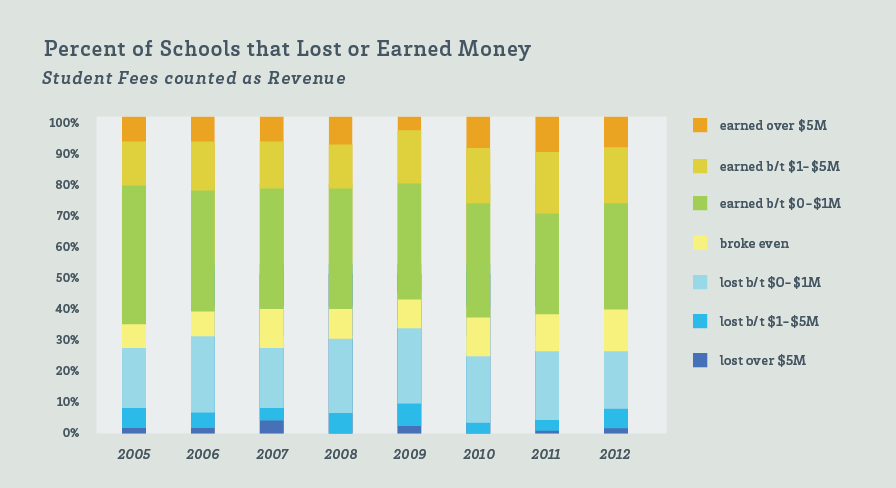
With Student Fees counted as a subsidy, over two-thirds (67.1%) of the 1,800 institutional years were net-negative, averaging loses of over $1 million. With student fees counted as revenue, only 6.7% of institutional years were in the red. Instead of 22% of the institution years breaking even or earning money, 71.4% would have operated in the black.
At the institutional level, 25 non-FBS teams would have broken even or earned money every year, compared with three; another 69 would have broken even or earned money in half of the years studied, compared with only 13 otherwise. Instead of 96 institutions losing money on athletics in every year studied, not a single one would have done so. In the FBS, the change is just as positive: 36 institutions would break even or earn money every year, compared with 11 otherwise, while another 59 would break even or earn money in half of the years studied, compared with 29 without fees counted as revenue. Only two teams would have lost money on athletics every year studied.
So, with student fees counted as revenue, 185 of the 227 institutions (81.5%) would have broken even or earned money in at least one year (when otherwise they would have lost money by counting student fees as subsidies), and 79 (34.8%) would have turned a financially red year into a black one five times or more. Only 42 institutions would not have seen a year flip from a negative to a positive. This is partially, however, due to the fact that 14 of those institutions didn’t even have any negative years to flip.
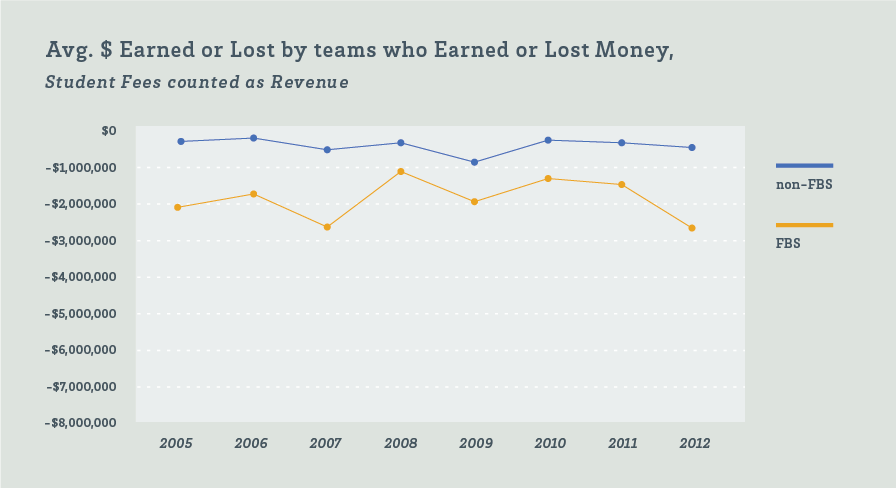
As the graph above indicates, in terms of hard dollars, FBS teams still would have lost more than non-FBS teams, but not nearly as much as they’d lost before fees were counted as revenue. Even more significant, neither FBS institutions nor non-FBS institutions would be on a downward trajectory as they were before counting fees as revenue.
Looking at the full eight-year span, 167 institutions out of the 227 (73.6%, as opposed to 17.6%) would have earned money or broken even over all. Of those 167 institutions, 85 were non-FBS schools, so just 39 (as opposed to 117) of the non-FBS teams studied would have lost money over the last eight years. As a whole, the NCAA institutions studied would have earned just under $48.6billion, meaning the difference between expenses and revenue would have been $+1.74billion, instead of -$4.69billion.