
The need for postsecondary institutions to field highly successful and revenue-generating athletic programs is well documented. Postsecondary institutions need successful athletic programs to both legitimize university status and to be an additional revenue stream for the university.
The support of athletic programs through institutional subsidies and student fees is also well-documented, by organizations such as the Knight Commission on Intercollegiate Athletics and the Delta Cost Project; however, few have attempted to quantify levels of efficiency within athletic departments – both at the departmental and sport levels.
Trending Total Athletic Expenditures and Athletic Success
Annually the National Association of Collegiate Directors of Athletics (NACDA) awards athletic departments points as part of the Learfield Sports Directors’ Cup. The Directors’ Cup represents a measure of entire athletic departmental performance, and awards athletic departments points for both sport sponsorship and athletic performance. The Directors’ Cup represents the most recognizable and accepted measure of athletic departments.
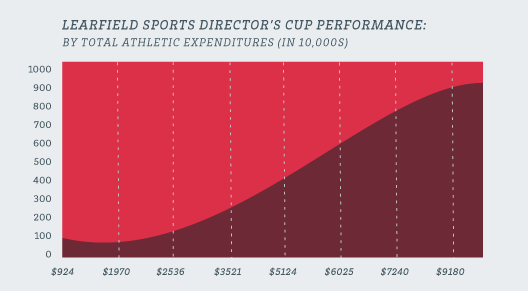
The graph above uses a quadratic form to plot performance on the Directors’ Cup by total athletic expenditures (in 10,000s). Data illustrates that there appears to be a diminishing return as an athletic department approaches the top 10th percentile in spending. Within the middle of the distribution, there appears to be consistent returns on investments (in terms of athletic performance). This return is directly related to the additional sponsorship and support of more athletic programs.
Measuring Conference Efficiency
Traditional measures of the athletic department efficiency rest with the comparison on marginal costs for increases in athletic performance. Using this framework (Table 1 – below), the Pacific-12 Conference had the lowest marginal costs associated with Directors’ Cup performance at $104,800 per Directors’ Cup point. The Mid-American Conference has the largest marginal costs for each Directors’ Cup point at almost 4x that of the Pacific-12 Conference – $380,300. The Mountain West was the highest-performing non-BCS conference, costing approximately $90,000 more in expenditures than the Pac-12 conference.
| FBS Conference | Average Marginal Cost |
| Pacific-12 Conference | $104,800 |
| Atlantic Coast Conference | $107,400 |
| Big Ten Conference | $120,500 |
| Southeastern Conference | $126,100 |
| Big 12 Conference | $135,900 |
| Mountain West Conference | $195,900 |
| Big East Conference | $207,700 |
| Conference USA | $274,200 |
| Western Athletic Conference | $303,000 |
| Sun Belt Conference | $305,800 |
| Mid-American Conference | $380,300 |
While marginal costs provide a good initial barometer for efficiency, there are additional factors that impact performance on the Directors’ Cup. The following table provides the average technical efficiency (see methodological note for information on the estimation parameters) for FBS conference between 2008 and 2011. The utilization of four years allows for efficiency estimates to control for abnormal years of success or “down” years.
Accounting for factors such as conference membership, sport sponsorship, institutional type and support, and athletic resource allocation, the table below provides the average technical efficiency (explanation of technical efficiency within the methodological note) by conference. In this case, the Big Ten represents the most efficient conference, followed closely by the Pac-12, SEC, and Big 12 Conference. The Atlantic Coast Conference is the least efficient of all BCS conferences. While the Mountain West Conference had the lowest marginal costs of non-BCS conferences, the Sun Belt Conference had the highest technical efficiency of non-BCS conferences.
| FBS Conference | Average Technical Efficiency |
| Big Ten Conference | 82.32% |
| Pacific-12 Conference | 80.98% |
| Southeastern Conference | 80.74% |
| Big 12 Conference | 79.97% |
| Sun Belt Conference | 77.94% |
| Atlantic Coast Conference | 73.85% |
| Conference USA | 72.67% |
| Western Athletic Conference | 72.12% |
| Mountain West Conference | 68.91% |
| Big East Conference | 67.21% |
| Mid-American Conference | 57.72% |
Redefining the Directors’ Cup Methodology
The major drawback with using the Directors’ Cup as a measure of institutional and conference athletic success is that the current calculation assumes all sports are equal. When using economic efficiency models, it is important to embed organizational priorities within resource allocations. Using sport-level expenditure data, we developed a weighted calculation using the proportion of athletic budgets allocated to each sport as a measure of priority and prominence. This weighting approach provides additional value to sports whose expenditures are greater within a school, directly proportional to dollars spent.
By using a dollars spent calculation, it allows for efficiency arguments to be articulated systematically. Institutions are given increased points for sports that have invested more into their operation. In most cases, men’s football and men’s basketball are the two most weighted sports; however, no athletic departments have the same weighting structure.
For example, the University of Texas’s football program has a weight of 0.1860 compared to 0.3207 at Ohio State University. This places higher expectations for athletic performance on the football program at Ohio State, since it comprises 32% of their adjusted Directors’ Cup rather than less than 10% within the original weighting. The impact of using the adjusted approach can be seen at athletic departments such as the University of Kentucky where their weight for football performance is nearly the same as their men’s basketball performance (0.16 compared to 0.15). For Kentucky, their basketball performance weight is 2x greater than the FBS average.
The table below provides a snapshot of the various point weights assigned to football and men’s basketball. All other sports would share the remaining weight value, directly proportional to their expenditure percentage.
| School | Conference | Football | Men’s Basketball | All Other Sports |
| The University of Texas at Austin | Big 12 Conference | 0.1860 | 0.0603 | 0.7537 |
| Ohio State University | Big Ten Conference | 0.3207 | 0.0467 | 0.6326 |
| University of Michigan | Big Ten Conference | 0.2106 | 0.0456 | 0.7438 |
| The University of Tennessee | Southeastern Conference | 0.1718 | 0.0643 | 0.7639 |
| University of Florida | Southeastern Conference | 0.2470 | 0.0867 | 0.6663 |
| The University of Alabama | Southeastern Conference | 0.3027 | 0.0652 | 0.6320 |
| Auburn University | Southeastern Conference | 0.3888 | 0.0758 | 0.5354 |
| University of Wisconsin | Big Ten Conference | 0.2475 | 0.0669 | 0.6857 |
| University of Oklahoma | Big 12 Conference | 0.2467 | 0.0894 | 0.6639 |
| Louisiana State University | Southeastern Conference | 0.2404 | 0.0479 | 0.7117 |
| University of Iowa | Big Ten Conference | 0.2346 | 0.0672 | 0.6982 |
| Florida State University | Atlantic Coast Conference | 0.2149 | 0.0685 | 0.7165 |
| Michigan State University | Big Ten Conference | 0.2266 | 0.1159 | 0.6575 |
| University of Kentucky | Southeastern Conference | 0.1648 | 0.1455 | 0.6897 |
| University of Nebraska-Lincoln | Big 10 Conference | 0.2459 | 0.0530 | 0.7010 |
| University of Louisville | Big East Conference | 0.1904 | 0.1630 | 0.6466 |
| University of Georgia | Southeastern Conference | 0.2729 | 0.0651 | 0.6621 |
| University of South Carolina | Southeastern Conference | 0.2792 | 0.0574 | 0.6634 |
| University of Arkansas | Southeastern Conference | 0.3030 | 0.1203 | 0.5767 |
| University of Minnesota | Big Ten Conference | 0.2152 | 0.0703 | 0.7145 |
| Texas A & M University | Southeastern Conference | 0.1987 | 0.0810 | 0.7203 |
| University of Oregon | Pacific-10 Conference | 0.2278 | 0.0745 | 0.6977 |
| University of North Carolina at Chapel Hill | Atlantic Coast Conference | 0.2415 | 0.0915 | 0.6669 |
One limitation to this approach is private institutions that do not publicly report athletic data. For these schools, they were assigned the average weight for each sport derived from all the school within their athletic conference who reported financial information.
We use the 2011 Directors’ Cup results to provide continuity with the research above. Table 1 below provides the final standings presented on the Directors’ Cup website. For the 17th straight year, Stanford University achieved the highest total point value.
Table 1: Unadjusted Directors’ Cup Results – 2011
| Institution | Rank | Final | Fall | Winter | Spring |
| Unadjusted | Total | Total | Total | Total | |
| Stanford | 1 | 1550.25 | 323.00 | 603.00 | 624.25 |
| Ohio State | 2 | 1277.05 | 369.00 | 517.30 | 390.75 |
| California | 3 | 1219.50 | 270.00 | 320.50 | 629.00 |
| Florida | 4 | 1212.25 | 175.00 | 392.00 | 645.25 |
| Duke | 5 | 1171.50 | 258.00 | 381.50 | 532.00 |
| North Carolina | 6 | 1160.75 | 380.00 | 368.00 | 412.75 |
| Virginia | 7 | 1092.00 | 244.00 | 225.50 | 622.50 |
| Texas A&M | 8 | 1090.50 | 103.00 | 420.50 | 567.00 |
| Florida State | 9 | 1079.00 | 361.50 | 309.00 | 408.50 |
| Oklahoma | 10 | 1064.75 | 237.50 | 433.25 | 394.00 |
However, after applying the expenditure proportional weights; the adjusted top twenty-five would have been as follows.
Table 2: Adjusted Directors’ Cup Ranking – 2011
| Institution | Rank | Rank | Difference |
| Unadjusted | Adjusted | Rank | |
| Stanford | 1 | 1 | 0 |
| Ohio State | 2 | 2 | 0 |
| North Carolina | 6 | 3 | 3 |
| Penn State | 13 | 4 | 9 |
| California | 3 | 5 | -2 |
| Duke | 5 | 6 | -1 |
| Arizona | 16 | 7 | 9 |
| Virginia | 7 | 8 | -1 |
| UCLA | 11 | 9 | 2 |
| Oklahoma | 10 | 10 | 0 |
| Florida State | 9 | 11 | -2 |
| Southern California | 14 | 12 | 2 |
| Florida | 4 | 13 | -9 |
| Maryland | 17 | 14 | 3 |
| Notre Dame | 18 | 15 | 3 |
| Texas A&M | 8 | 16 | -8 |
| Wisconsin | 26 | 17 | 9 |
| Washington | 21 | 18 | 3 |
| Michigan | 15 | 19 | -4 |
| Indiana | 28 | 20 | 8 |
| Connecticut | 44 | 21 | 23 |
| Auburn | 31 | 22 | 9 |
| Arkansas | 24 | 23 | 1 |
| Minnesota | 29 | 24 | 5 |
Stanford University and Ohio State remain the top two programs even after adjusting for sport priority; however, Penn State and Arizona University both made the jump into the top ten – each gaining 9 positions from their previously unadjusted ranking. Results indicate that taking into consideration the importance of institution-specific priorities provide a more robust measure of intercollegiate athletic success.
Thoughts for Practice
The Directors’ Cup provides a solid foundation for examining overall athletic departmental success. However, using a modified approach that takes into account institutional investments and priorities placed on various sports allows this measure to more accurately and appropriately compare athletic department success. Within the paper, key take away for athletic decision makers in terms of increase overall athletic success might be:
- From a purely economics approach, there exists a diminishing return for total athletic expenditures on athletic success as measured by the Directors’ Cup; however, the effort to maintain a top performing athletic department may outweigh the increased costs associated with each point increase.
- Automatic qualifying (BCS member) institutions have a higher level of average technical efficiency than non-automatic qualifying conversations.
- Targeted expenditure categories appear to have the larger impact on increasing overall athletic efficiency than others.
- Investing in expenditures that directly impact student athletes has the largest impact on athletic efficiency – a 10% increase in direct student athlete expenditures produces an estimated increase of 7% in athletic outcomes.
- The adjusted Directors’ Cup approach allows for athletic leaders to see a more comparable and equitable approach to athletic success – moving the value from broad-based athletic sponsorship to one of success within sports that receive the largest institutional investment.
Methodological Note: To account for the complexities associated with estimating economic data, contemporary parametric models were used with assumed functional forms. To estimate the cost frontier, a balanced panel data on intercollegiate athletic departments was used for the years 2007/08 to 2010/11. Based on the available data, a generalized Cobb–Douglas stochastic cost function was used to estimate the technical efficiency of each athletic department. The adoption of a traditional log–log specification allowed for the possible nonlinearity of the frontier and was in line with traditional econometric utilization of frontier models.
Technical efficiency is the effectiveness with which a given set of inputs is used to produce an output. A firm is said to be technically efficient if a firm is producing the maximum output from the minimum quantity of inputs, such as labor, capital, and technology. Technical efficiency assumes that the optimal would be production maximization.
About the Author